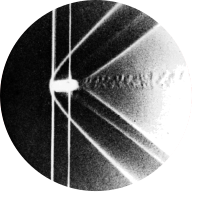
Fig 224. Projectile at near-sonic speed
Table of Content
$$ \vcenter{M = 0.978} $$
$$ \vcenter{M = 0.990} $$ “Still closer to the speed of sound, the shock-wave pattern of the preceding pages had spread laterally to great distances. These two photographs are from the same firing, so that the second one was actually taken earlier in the trajectory” Photographs by A. C. Charters, in von Kármán 1947
Series #
This figure is part of a series together with figure 223 and figure 253, which illustrate the transition from subsonic to supersonic flow for the same type of artillery shell. The suggested reading order is:
- Figure 253, which provides a heuristic exposition of different types of shockwaves.
- Then the current post, which addresses the conceptual challenge of simulating transonic flow.
- Finally figure 223, which discusses the two relevant modeling equations: the compressible Navier-Stokes equations and the Euler equations.
The transonic flow problem #
The convex corners and shockwaves cause transitions between subsonic and supersonic flow. Computational Fluid Dynamics (CFD) for this so-called transonic flow is quite complex. To understand this better, we explore the history of CFD solvers and how the complexities of transonic flow manifest themselves.
In transonic flow, the change in velocity around Mach 1 complicated early CFD computations. This is evident in the non-linear perturbation velocity potential equation for transonic flow, which was used historically and is derived from the definition of the velocity potential \(\phi\) in 2D:
$$
\mathbf{V} = \nabla \phi \\
u = V_{\infty} + \hat{u} \\
\hat{u} = \frac{\partial \hat{\phi}}{\partial x} \\
v = \hat{v} = \frac{\partial \hat{\phi}}{\partial y}
$$
In this context, \(u\) and \(v\) represent the Cartesian velocity components in the \(x\) and \(y\) directions, respectively. \(V\) denotes the velocity magnitude, \(V_{\infty}\) is the free-stream velocity, and the hats refer to the perturbation components (increments), which can be understood from the following figure:

For steady, irrotational, compressible, inviscid 2D flow, the continuity, momentum, and energy equations may be rewritten into a single equation for the velocity potential \(\phi\): $$ (1-M_{\infty}^2) \frac{\partial^2 \hat{\phi}}{\partial x^2} + \frac{ \partial^2 \hat{\phi}}{\partial y^2} = M_{\infty}^2 [(\gamma + 1)\frac{\partial \hat{\phi}}{\partial x}\frac{1}{V_{\infty}}] \frac{\partial^2 \hat{\phi}}{\partial x^2} $$ The key thing to note in this equation is the factor \((1 - M_{\infty}^2)\), which is greater than 0 in subsonic flow and less than 0 in supersonic flow. This distinction results in the equation taking different forms: in supersonic flow, it is a hyperbolic partial differential equation, while in subsonic flow, it is an elliptic partial differential equation. The difference in nature of these types of partial differential equations (PDEs) lies in the flow of information: for hyperbolic PDEs information flows unidirectionally and points downstream are only affected by points upstream. Differently, for elliptic PDEs information flows in all directions and all points in space affect each other. This difference in mathematical type highlights the significant physical differences between subsonic and supersonic flow.
In terms of computation, these two fundamentally different types of PDEs require different numerical solution strategies. For transonic flow, the solution strategy must switch depending on the nature of the flow, or complex strategies must be developed that can handle both. The transition region, where the flow changes from supersonic to subsonic or vice versa, is very thin, making it particularly challenging to simulate accurately.
The above equation was employed in the earliest transonic CFD simulations. Later, the Euler equations were used, which predict shockwaves reasonably well but do not perform adequately in transonic flow due to the interaction of shockwaves with the boundary layer, which requires accounting for viscosity. The current state of the art for transonic flow involves solving the compressible Navier-Stokes equations with the viscous term included. However, the turbulence model often remains the Achilles’ heel of these complex calculations [1]. For a comparison between viscid and inviscid simulations, refer to Figure 223.
Simulation & Visualization #
The set-up of the simulation and visualization is described in figure 253.
References #
- [1] Anderson, J. D. (2016). Fundamentals of aerodynamics (6th ed.). McGraw-Hill Education.
- [2] https://www.sciencedirect.com/science/article/pii/S0376042117300271
- [3] https://ieeexplore.ieee.org/document/10082199
- [4] https://www.nas.nasa.gov/assets/nas/pdf/ams/2018/introtocfd/Intro2CFD_Lecture7_Zingg.pdf
