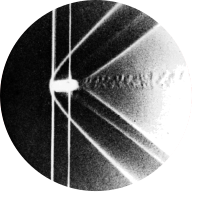
Fig 223. Projectile at high subsonic speeds
Table of Content
$$ \vcenter{M = 0.840} $$
$$ \vcenter{M = 0.885} $$
$$ \vcenter{M = 0.900} $$
$$ \vcenter{M = 0.946} $$
$$ \vcenter{M = 0.971} $$ “The spark shadowgraphs on these two pages have been arranged to show the shock-wave pattern growing into the subsonic field around a model of an artillery shell as its Mach number is increased. The shell is in free flight through the atmosphere at less than \(1.5^{\circ}\) incidence. These five photographs are from four different firings, in each of which the Mach number is gradually decreasing as the shell decelerates.” Photographs by A. C. Charters, in von Kármán 1947
Series #
This figure is part of a series together with figure 224 and figure 253, which illustrate the transition from subsonic to supersonic flow for the same type of artillery shell. The suggested reading order is:
- Figure 253, which provides a heuristic exposition of different types of shockwaves.
- Figure 224, which addresses the conceptual challenge of simulating transonic flow.
- And then the current post, which discusses the two relevant modeling equations: the compressible Navier-Stokes equations and the Euler equations.
Governing equations #
Viscosity in transonic flow #
The experiment of figures 223, 224 and 253 covers a Mach number range from 0.840 to 1.015. The conceptual challenge behind handling the transonic regime is discussed in Figure 224, although this is highlighed for an inviscid study case. In fact, viscosity effects are crucial for solving transonic flow problems. In particular, Figure 253 explains that the \(\lambda\)-shock wave observed at the rear of the artillery shell is a case of shockwave boundary layer interaction. The current post examines the importance of viscosity by comparing simulation results with and without viscosity.
The compressible Navier-Stokes equations #
Flow is typically described by the Navier-Stokes equations, a set of partial differential equations that cover the conservation of mass, momentum, and energy: $$ \begin{cases} \frac{\partial \rho}{\partial t} + \nabla \cdot (\rho \mathbf{u}) = 0 \\ \rho(\frac{\partial \mathbf{u}}{\partial t} + \mathbf{u} \cdot \nabla \mathbf{u})= - \nabla p + \nabla \cdot { \mu[\nabla \mathbf{u} + (\nabla \mathbf{u})^T - \frac{2}{3}(\nabla \cdot u) I]+\zeta(\nabla \cdot \mathbf{u})I} + \rho g \\ \frac{\partial e}{\partial t} + \mathbf{u} \cdot \nabla e = - \frac{p}{\rho} \nabla \cdot \mathbf{u} \end{cases} $$ These equations have to be supplemented with an equation of state that relate the pressure, density and temperature. We use the ideal gas law: $$ p = \rho R_s T $$
Solving these equations in all their detail (i.e., by means of “Direct Numerical Simulation”, DNS) can be very computationally expensive as the onset of turbulence leads to a wide range of physical scales that would have to be computed. Instead, in the simulations discussed in this post, the Reynolds-averaged Navier-Stokes (RANS) equations are used. This approach is explained in detail in Figure 47. Alternatively, one may use Large Eddy Simulation (LES), where small turbulent scales are filtered out, refer to Figure 103.
The Euler equations #
In some cases involving high velocities, it can be argued that the viscous effects (the terms in the Navier-Stokes equations involving the dynamic viscosity \(\mu\) and the bulk viscosity \(\zeta\)) are negligible. Consequently, these terms can be omitted, leaving the Euler equations: $$ \begin{cases} \frac{\partial \rho}{\partial t} + \nabla \cdot (\rho \mathbf{u}) = 0 \\ \rho(\frac{\partial \mathbf{u}}{\partial t} + \mathbf{u} \cdot \nabla \mathbf{u})= - \nabla p + \rho g \\ \frac{\partial e}{\partial t} + \mathbf{u} \cdot \nabla e = - \frac{p}{\rho} \nabla \cdot \mathbf{u} \end{cases} $$ These equations still involve four unknowns: density, pressure, velocity, and energy or enthalpy, and again the ideal gas law is used as an additional equation.
The absence of viscosity means that the walls will exhibit full slip, and the boundary layer will be absent, leading to higher velocities at the surface.
Euler / Navier-Stokes comparison #
Now, a comparison can be made between the inviscid and the viscid case. The simulations shown above, which are compared with the experiment, are run based on the (Reynolds-Averaged) Navier-Stokes equations with a k-epsilon turbulence model. Now, they are repeated without viscosity, leading to the following results:
$$ \vcenter{M = 0.840} $$
$$ \vcenter{M = 0.885} $$
$$ \vcenter{M = 0.900} $$
$$ \vcenter{M = 0.946} $$
$$ \vcenter{M = 0.971} $$ The first observation is that with the Euler equations, the shockwaves are larger at lower Mach numbers. This is likely due to the no-slip wall condition, resulting in higher flow velocity at the wall. Additionally, the wake downstream of the artillery shell is significantly smaller in the Euler simulations. This is because the wake, which is a form of flow separation and turbulence, is not modeled in the Euler equations. In conclusion, the simulations using the (Reynolds-Averaged) Navier-Stokes more closely resemble the figures from the original experiment.
Simulation & Visualization #
The set-up of the simulation and visualization is described in figure 253.
